The African Cup of Nations 2019 is the 32nd edition of the African Cup of Nations, which will be held in Egypt from June 21 to July 19, 2019. It is the first organized event of 24 participating teams and to take place in summer. The organization of the tournament is good news for Egypt, because of its infrastructure and its many hotels, which encourages the return of the public and the tourism, the increase of the national income coming from foreign currencies, a strong occupation hotels and jobs. The organization of any international sporting event, regardless of the challenges or lack of time before the event, has raised many expectations about the importance of winning this organization in terms of economy and well-being that will come back in the Egyptian state to the next step.
Breakdown of the teams after the draw
Group A: Egypt, Congo, Uganda and Zimbabwe.
Group B: Nigeria, Guinea, Madagascar, Burundi.
Group C: Algeria, Senegal, Kenya, Tanzania.
Group D: Morocco, Ivory Coast, South Africa, Namibia.
Group E: Tunisia, Mali, Mauritania, Angola.
Group F: Cameroon, Ghana, Benin, Guinea-Bissau.
Breakdown of teams according to their economic growth
The World Bank expects Egypt’s economic growth to reach an average of 4.2% change for the current fiscal year 2018/2019, thanks to the improved business climate, investment growth and high consumption private.
Below is an overall scope of the GDP and Growth Rate of each country participating in CAF 2019:
|
Group A |
Egypt | Congo | Uganda | Zimbabwe |
|
GDP per capita |
235.37 Billion (US $ 2413 per capita) | 8.7 Billion ( US $ 1654 per capita) | 26 Billion (US $ 606 per capita) | 22.04 Billion (US $ 1333 per capita) |
|
Economic growth rate |
4.2% | -4.6% | 4.5% | 3% |
| Group B | Nigeria | Guinea | Madagascar |
Burundi |
|
GDP per capita |
375.75 Billion (US $ 1968 per capita) | 10.47 Billion (US $ 823 per capita) | 11.5 Billion (US $ 450 per capita) | 3.17 Billion (US $ 292 per capita) |
|
Economic growth rate |
0.8% | 6.7% | 4.1% | 0% |
|
Group C |
Algeria |
Senegal | Kenya |
Tanzania |
|
GDP per capita |
167.56 Billion (US $ 4055 per capita) | 21.07 Billion (US $ 1329 per capita) | 79.26 Billion (US $ 1595 per capita) | 52.09 Billion (US $ 936 per capita) |
|
Economic growth rate |
2.2% | 7.2% | 4.8% | 6% |
|
Group D |
Morocco |
Ivory Coast | South Africa |
Namibia |
|
GDP per capita |
109.71 Billion (US $ 3007 per capita) | 37.35 Billion (US $ 1538 per capita) | 348.87 Billion (US $ 6151 per capita) | 13.25 Billion (US $ 5231 per capita) |
|
Economic growth rate |
4.2% | 7.8% | 1.3% | -1.2% |
|
Group E |
Tunisia |
Mali | Mauritania |
Angola |
|
GDP per capita |
39.95 Billion (US $ 3464 per capita) | 15.33 Billion (US $ 827 per capita) | 5.02 Billion (US $ 1137 per capita) | 122.12 Billion (US $ 4100 per capita) |
|
Economic growth rate |
1.9% | 5.3% | 3.2% | 0.7% |
|
Group F |
Cameroon |
Ghana | Benin |
Guinea-Bissau |
|
GDP per capita |
34.92 Billion (US $ 1452 per capita) | 59 Billion (US $ 2046 per capita) | 9.25 Billion (US $ 827 per capita) | 1.35 Billion (US $ 724 per capita) |
|
Economic growth rate |
3.2% | 8.4% | 5.6% | 5.5% |
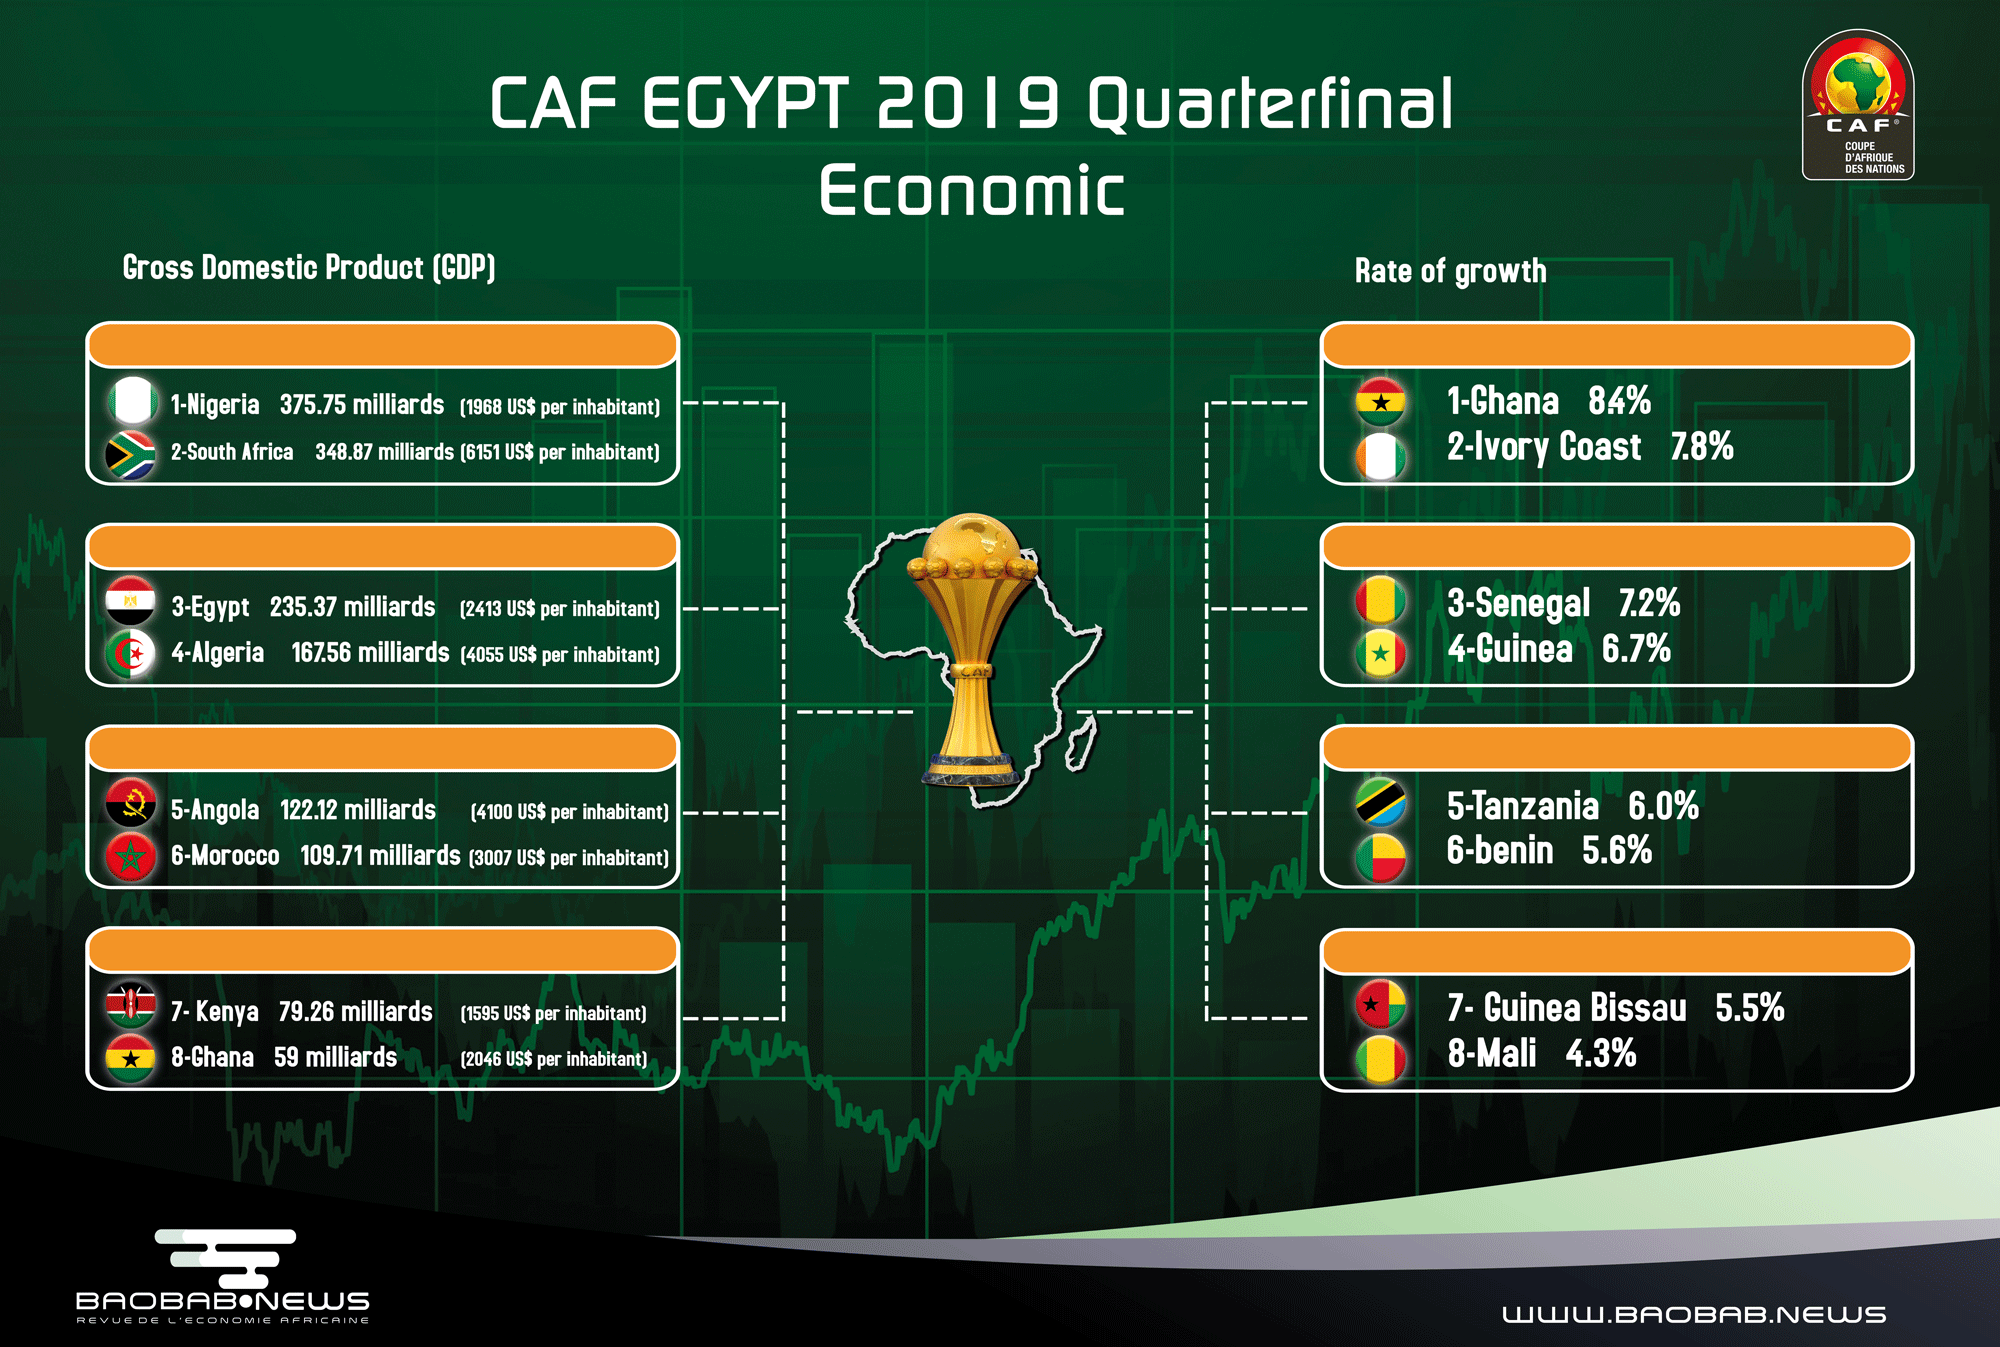
Ranking of the 8 finalist teams by GDP
|
Rank (World) |
Rank (Africa) | Country |
Gross Domestic Product (GDP) |
| 31 | 1 | Nigeria |
375.75 Billion (US $ 1968 per capita) |
| 33 | 2 | South Africa |
348.87 Billion (US $ 6151 per capita) |
| 45 | 3 | Egypt |
235.37 Billion (US $ 2413 per capita) |
| 54 | 4 | Algeria |
167.56 Billion (US $ 4055 per capita) |
| 58 | 5 | Angola |
122.12 Billion (US $ 4100 per capita) |
| 62 | 7 | Morocco |
109.71 Billion (US $ 3007 per capita) |
| 69 | 9 | Kenya |
79.26 Billion (US $ 1595 per capita) |
| 76 | 10 | Ghana |
59 Billion (US $ 2046 per capita) |
Ranking of the 8 finalist teams by Growth rate
|
Rank |
Rank (Africa) |
Country |
Growth rate |
| 1 | 3 | Ghana | 8.4% |
| 2 | 4 | Ivory Coast | 7.8% |
| 3 | 5 | Senegal | 7.2% |
| 4 | 6 | Guinea | 6.7% |
| 5 | 10 | Tanzania | 6.0% |
| 6 | 11 | Benin | 5.6% |
| 7 | 12 | Guinea-Bissau | 5.5% |
| 8 | 13 | Mali | 4.3% |
Keywords : Africa, News, Economy, CAF EGYPT 2019, Quarterfinal, GDP, Growth rate
Baobab News
Redaction : S.MARAI
© Credit Graphics : Baobab News